


Above-average solar irradiance lifted performance across Europe, East Asia and Australasia, while extreme weather cut output in India, Central America and Southeast Asia, new Solargis analysis shows.
Global solar performance exceeded expectations across several major markets in 2025, according to newly released data from Solargis, highlighting both the growing potential — and increasing climate sensitivity — of solar energy worldwide.
Solargis’ annual Global Horizontal Irradiation (GHI) analysis reveals that parts of East Asia recorded solar irradiance levels 15–20% above long-term averages, while most of Europe experienced gains of up to 10%, supporting strong photovoltaic (PV) output during a record year for renewable energy deployment.
At the same time, climate-driven weather extremes caused significant dips in solar irradiance across the Indian subcontinent, Central America and parts of Southeast Asia, reinforcing the need for advanced solar resource monitoring as solar becomes a backbone of global electricity systems.
A record year for renewables — powered by solar
2025 marked a milestone for clean energy, with more than 800 GW of new renewable capacity added globally. Solar accounted for nearly 80% of that growth, making accurate irradiance forecasting and performance analysis more critical than ever.
Using satellite data compared against long-term averages, Solargis’ Global Solar Performance Maps show how solar projects around the world deviated from expected output.
Where solar outperformed
East Asia
Central East China stood out as one of the strongest-performing regions globally, with irradiance levels around 15% above average, and parts of the Sichuan Basin reaching +20%. This continues a multi-year trend of above-normal solar conditions. Japan and South Korea’s eastern coastal regions also posted gains of 4–10%.
Europe
Europe broadly benefited from sunnier conditions. The UK recorded its sunniest year on record, while Benelux countries and parts of Western and Central Europe saw irradiance levels 4–10% above normal, boosting solar generation across the continent.
Australasia
Southeast Australia and New Zealand experienced irradiance levels 3–10% above long-term averages, with even stronger anomalies — exceeding 15% — recorded in parts of Papua New Guinea.
Where climate impacts reduced solar output
Despite fewer extreme weather events in North America, Central America saw notable declines. Countries including Panama, Costa Rica and Nicaragua experienced 7–12% below-average irradiance, driven by a more intense hurricane season and higher rainfall.
In India, a second consecutive year of stronger-than-normal monsoons led to widespread reductions in solar irradiance of 1–8%, with coastal regions dipping to –10%. Southeast Asia faced similar challenges, as La Niña-linked rainfall reduced GHI levels across Vietnam, Malaysia and surrounding islands.
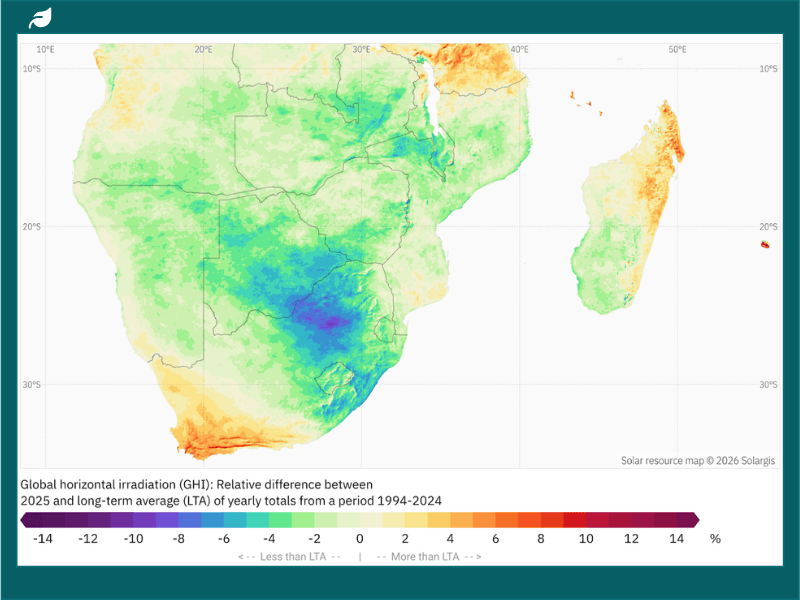
Parts of Southern Africa, particularly around Johannesburg and Pretoria, also recorded irradiance levels up to 8% below average.
Solar success now depends on data
Marcel Šúri, CEO and Founder of Solargis, said 2025 illustrated both solar power’s promise and its vulnerability to climate volatility.
“Solar is now a cornerstone of the global energy system, and its role will only grow,” he said. “But 2025 showed extremes — some regions far exceeded expectations, while others suffered major shortfalls due to weather.”
“With La Niña expected to persist into 2026, solar asset owners must plan for increased variability. Investing in high-quality solar data and software is no longer optional — it’s essential for protecting performance, profitability and grid reliability.”
A climate-sensitive energy future
As solar continues its rapid expansion, Solargis’ findings underline a crucial reality: climate change is reshaping where, when and how solar performs best. Markets with strong irradiance gains may see accelerated investment, while regions exposed to extreme weather will require more resilient system design, forecasting and risk management.
The full 2025 Global Solar Performance Maps are available via Solargis.
Looking for a solar installer?
Compare MCS-certified solar panel installers across the UK in our directory, with ratings, reviews and free quotes, listed by county.
Related solar guides: