
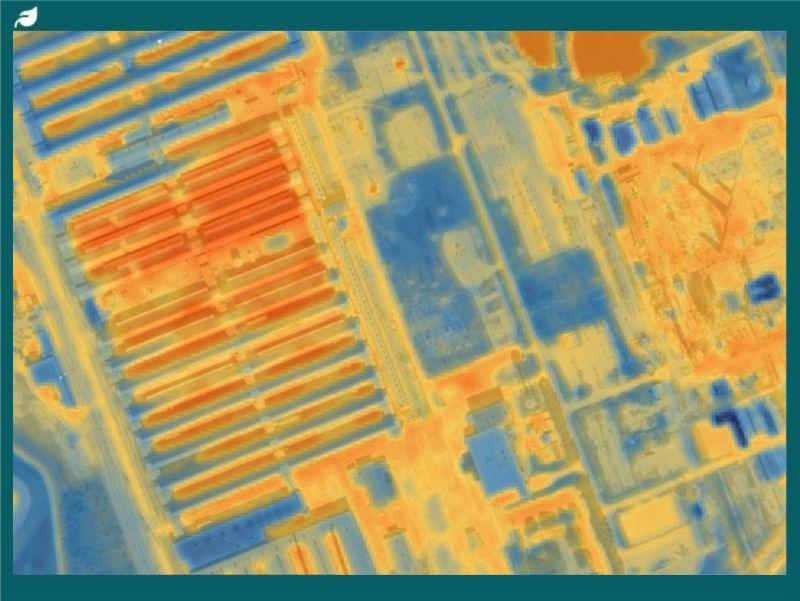
Satvu works on technology capable of monitoring blast furnaces and kilns in steel and cement production, to detect flaring intensity and shutdowns in oil and gas operations. They provide near real-time visibility into critical infrastructure. Recently, they have released a first-of-its-kind thermal image of one of the largest crypto mining data centres in the United States.
This imagery provides independent, near-real-time insight into when data centre infrastructure actually comes online, how capacity is used and how energy demand is distributed. With global demand for AI, cloud and crypto services on the up, high-resolution thermal intelligence offers a new level of transparency into the growth, impact and energy footprint of large-scale digital infrastructure.
Data centres have grown in recent years, and now some of the world’s most energy-intensive facilities. This expansion has often outpaced the abilities of regulators, operators, analysts and communities to clearly understand when new sites come online, how much capacity they are adding and what this means for local power systems.
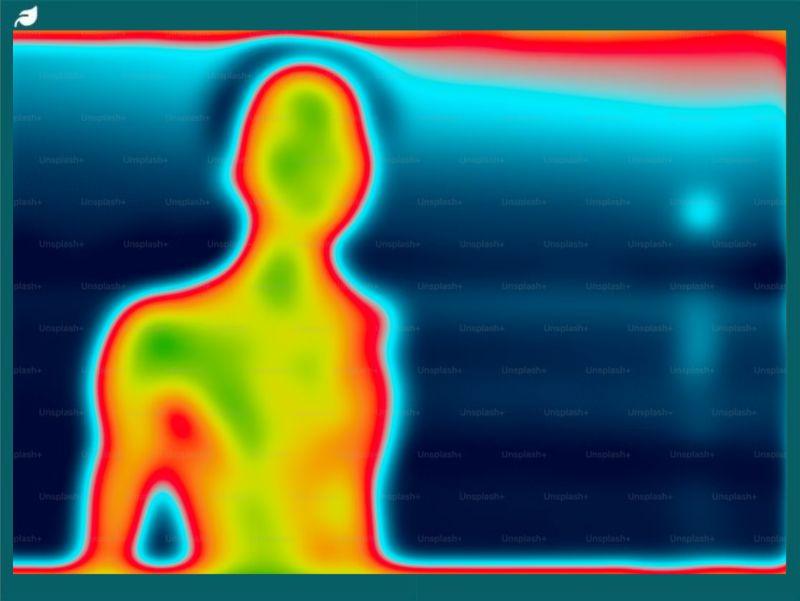
SatVu’s thermal data changes that. It offers a new, independent layer of visibility into this infrastructure, showing operational activity exactly as it happens. The newly released image captures distinct thermal signatures across rooftop chillers, transformers and electrical yards, making clear where the facility is active or dormant. The heat patterns reveal how activity is distributed across a compass, and whether new phases are ramping as expected, as well as how energy use shifts over time.
This form of clarity is increasingly important for a wide range of stakeholders. Regulators and grid operators want better insights into how large energy users affect local power systems, whilst analysts want to understand how and where capacity is growing, and how quickly new hubs are becoming operational. Meanwhile, the general public watches the environmental footprint of digital infrastructure.
Thermal intelligence provides the necessary information by offering both the broad picture and the finer detail. From a wide-range view, it shows whether an entire facility is active, or if only certain sections are. At a closer level, it reveals which substations and cooling systems are under load – clear, physical indicators of real operational behaviour. When combined, these layers help provide a grounded, evidence-based view of how major data centres are evolving in real time.
Thomas Cobti, VP Business Development, SatVu, said: “Today’s data centre buildout is moving incredibly quickly, and the world needs better ways to understand what’s actually happening on the ground. Thermal data gives an objective view of operational activity as it occurs – not weeks later through reports or announcements.”
Global investment in data centres is continuing its rapid surge. McKinsey estimates that more than $7 trillion will be spent worldwide by 2030, with US demand alone growing 20-25% annually. As this expansion accelerates, so does attention on grid strain, regional growth patterns, environmental impact and the broader resilience of energy systems. There is a need for independent, near-real-time visibility into these sites that offer a way to understand the scale and impact of this shift.
With pressure mounting on energy systems, climate commitments and digital infrastructure growth, understanding what is actually happening inside large-scale facilities is essential. By revealing operational reality, thermal intelligence offers a path forward for cutting through uncertainty and bringing clarity to one of the fastest-growing sectors on the planet.